Tuesday, October 7, 2014

Gauss's Law

September 30, 2014

This is an illustration of the flux lines.

This is one way to define flux.

We were asked which situation we would chose to do when a lighting strikes.
The professor demonstrated some stuff by putting different objects in a microwave. This is a picture of a cd in a microwave.
The sparks and flames were produced.
This is the result which burned holes on the cd.


A lit match was placed inside the microwave and it produced plasma ball, which are caused by the combustion of water vapor.

A steel wool was placed inside the microwave and it create sparks.
A light bulb was placed inside the microwave which produced different colored lights until the light bulb burned a hole and got caught on fire. A piece of soap was also placed in the microwave but due the dryness of the soap a reaction could not be seen, so a video on youtube was played to show how the soap would have reacted.
The top and bottom pictures are take from the lab manual answer the questions.


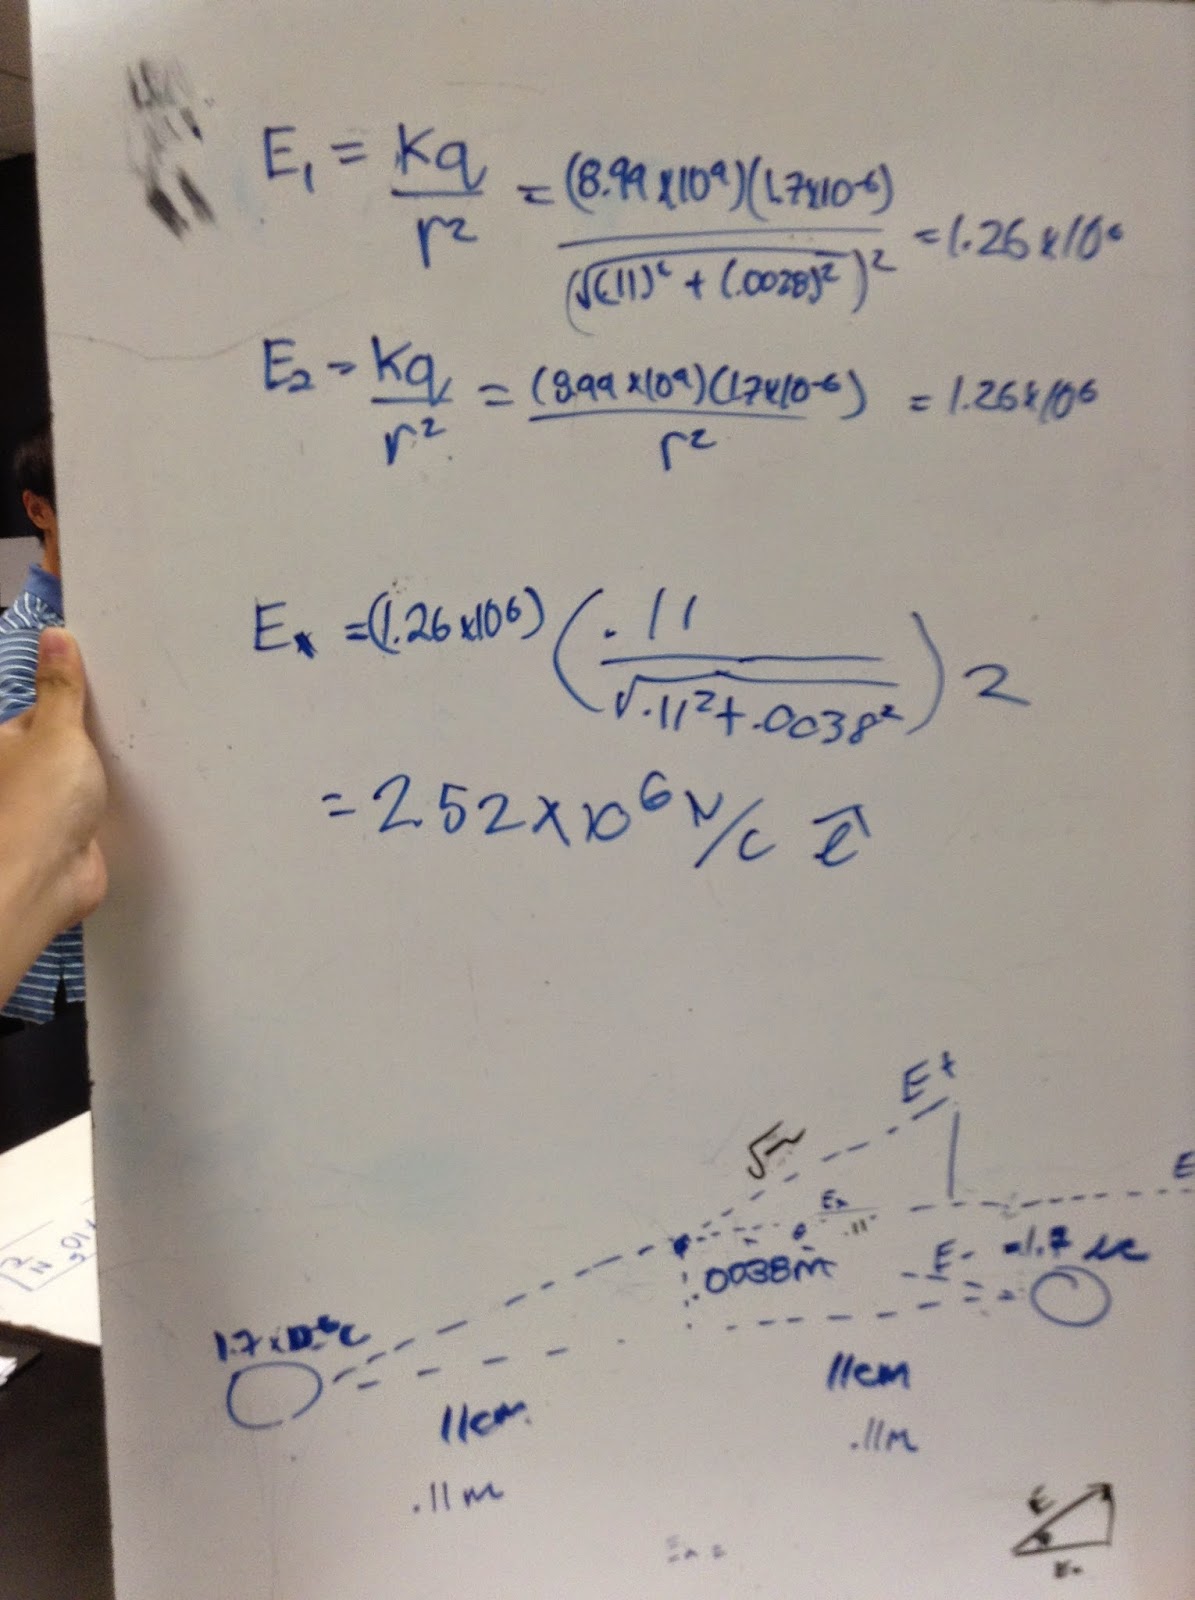
This is a solution showing how the solve the point charge is derived. 

Dipole Moments

September 25, 2014
We were asked to illustrate the trajectory of the electron across the charged plates.
This shows the torque on the positive and negative charge
This set up are the van de Graff and the Faraday cage.When the van de Graff is turned on the aluminum strips hanging from the cage move, but only the strips outside the cage. The aluminum inside the cage did not move is cage by the shielding effect

This is from the drawing a normal vector found in the notes and the lab manual.


This picture is taken from a computer screen from activphysics.

These are some of the answer from activphysics.

Electric Field

September 22, 2014

These four statements are ideas related to experiments found in the notes.

The questions from these answers are found on activphysics.

These values are for the electric field vector from two point charges activity.
This is a continuation of the activity and we need to find the resultant E vector at each point.


This is an illustration from an extended charge distribution.

These values are the given and the results for the extended charge distribution activity.

This is the integral and solution to solve for E by relating the magnitude of the electric field. 


This is the solution to find the size of the electric field 3.80 mm above the origin.


Electric Field Hockey Level 2
Electric Field Hockey Level 3

Electric Force

September 18, 2014

The class started with a demonstration using a different furs and balloons.

The balloon was rubbed against the fur causing the balloon to stick to the glass, as seen in the picture.

A silk handkerchief was used to rub against a balloon also causes the balloon to stick to the glass.

These illustrations showed how the silk handkerchief stuck to the glass.

We were asked how we would define mass and charge in terms of attraction and force.


This is the free body diagram on the forces of two balls with the same charge to help solve for the angle theta between the equilibrium point of the hung ball and displacement location of the hung ball after the other charged ball got closer to the hung ball. Then we solve a problem in the lab manual where a boy was at a swing and we were asked to solve for the forces on the swing and the boy.

This is a logger pro graph of a video where two charged balls, one hung on a string and the other attached on a rod.

This electrostatic generator was used to demonstrate a few example how the electrons move.
This plasma ball can properly show how the electrons move.


PV Diagram

September 11, 2014

This is a reversible thermometric demonstrator.

The class began will an demonstration showing how the heat can transfer from one side of the apparatus to the other.

This set up is used to demonstrate how the P-V diagram works.

This graph shows and proves that the process cannot be isothermal, isobaric, or isochoric.

These are the values of the graph, which shows how the non of the values remained constant.

These value are rewritten values from the PV diagram

The pictures on top and bottom show the work done by the system.


This solution shows the specific heat when pressure is constant in terms of R.

These equations are used to prove that P minus V^gama is an constant for an adiabatic expansion

This calculation shows the relationship between temperature and volume in an adiabatic process.

Given the relationship of pressure and volume in an adiabatic process, we calculated how the relationship of pressure and volume to solve for an equation to find work in an adiabatic process.

Some calculations were added on the left side of the white board solving a question from the lab manual.


This shows how the Carnot cycle is analyzed. Calculating the change in internal energy, work and heat, and also the efficiency of the system.