September 9, 2014
At the beginning of the class, we were asked to predict how a lit candle will behave when dropped into a cylinder, the result is shown below. Then a smaller candle was lit and dropped into the cylinder but this think a pipe is included in the cylinder creating an air flow preventing the flame from being extinguished.
This shows the result of the candle being dropped into the cylinder.
We were asked to predict how the flame will react when the candle is inside a bottle, illustrated by the drawing.We predicted that the flame will burn more brightly. A video was played displaying the experiment. The video proved our prediction to be wrong, and the flame got dimmer by diffusion.
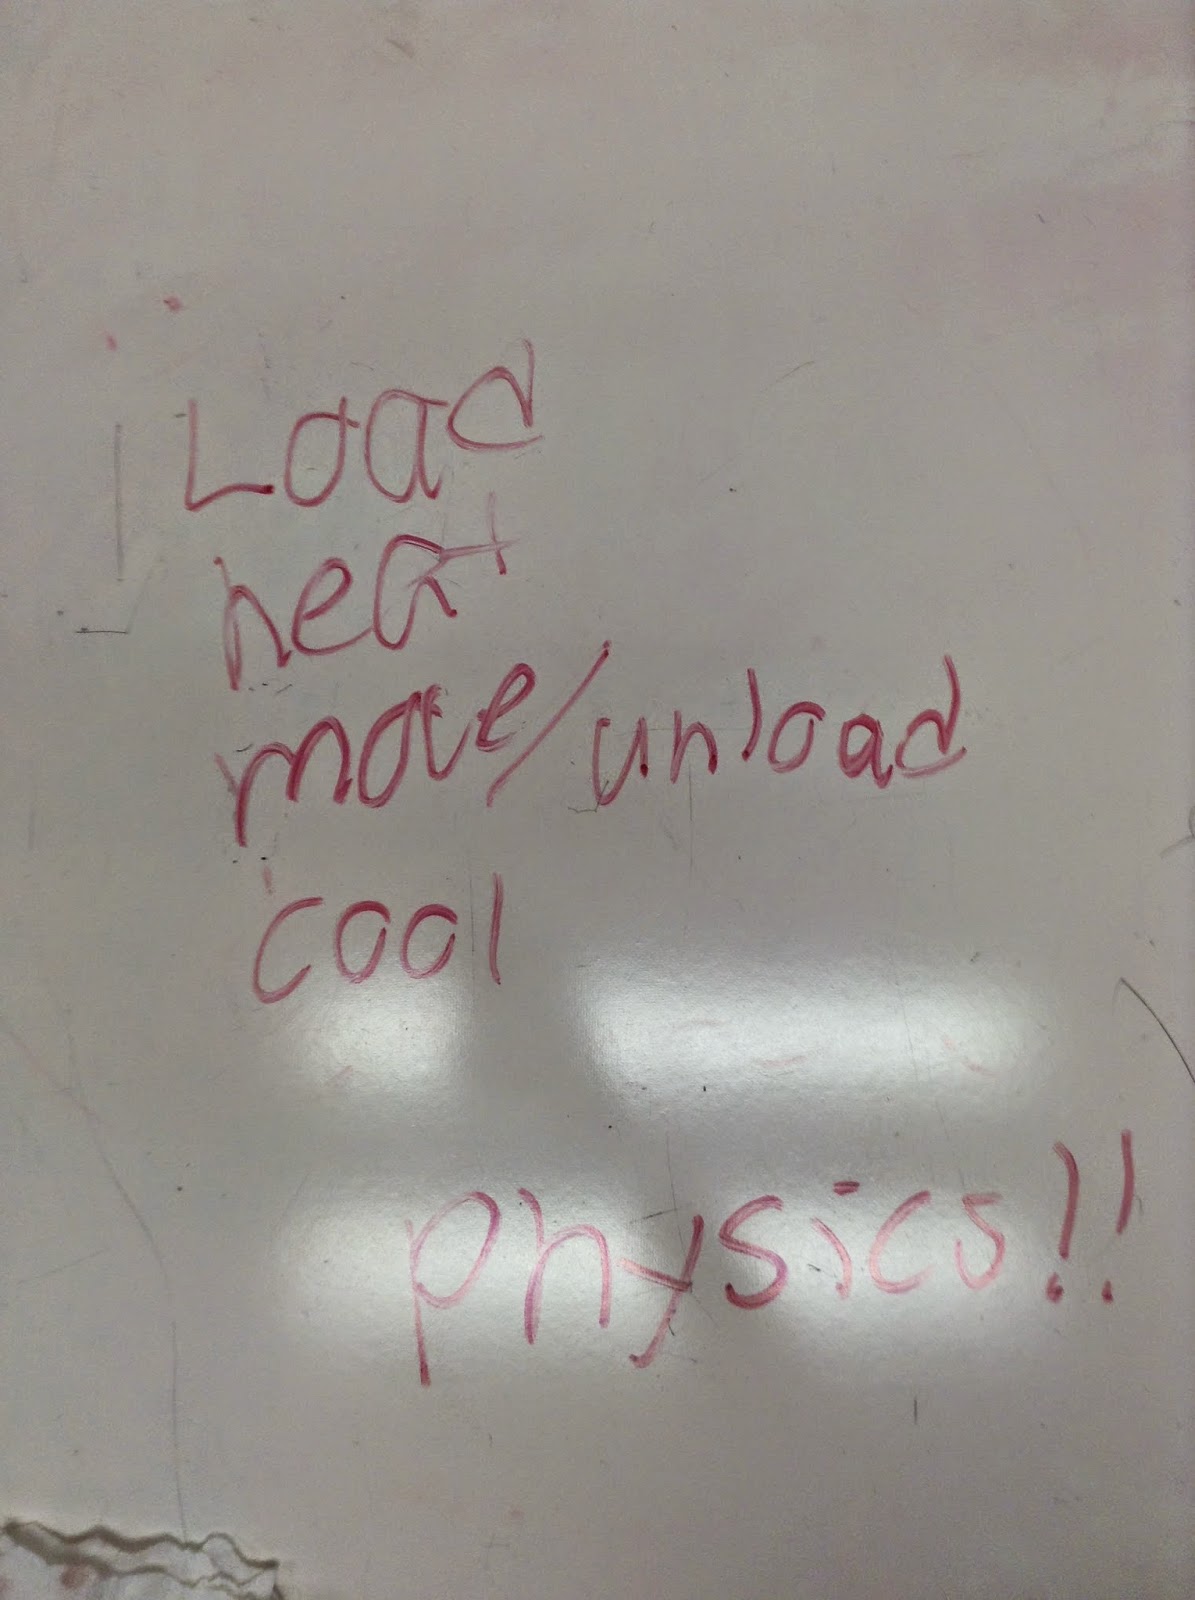
We developed a lifting engine cycle using a rubber band, heat source, and a can. First we loaded the can to the rubber band. Heat the rubber band causing the rubber band to contract and lift the can. Then move the system to the desired location and unload the can. Then we cooled the rubber band, and the process is repeated until all the cans are moved.
This calculation shows how the efficiency of an engine is related to the heat gained and heat lost.
A compressed spring has been gone through negative work, gaining potential energy.

The isobaric process (#1) shows the linear relationship between volume and temperature. Isochoric process(#3) has a linear relationship between pressure and temperature. The third one is a graphic representation of the inverse relationship between pressure and volume which is an isothermal process.

These calculations prove that during an isobaric process (#4) the temperature decrease, volume decreases as well and during an isochoric process (#5) temperature increases, pressure also increases.

This calculation shows how volume decreases, pressure increases which proves the isothermic process.
We were asked to identify which graph represented what process.
These calculations, top and bottom, show how much work it takes to pump water up to the tank
The gas law apparatus can show how decrease in volume can increase the pressure and while trying to keep the temperature constant.
This calculation shows how much work it took to increase the pressure.
These calculations show how to analyze a pressure-volume cycle, showing how the internal energy changes with different situations.
This calculation shows the efficiency of the cycle, using the heat gain and heat loss during the process.


No comments:
Post a Comment